Abstract
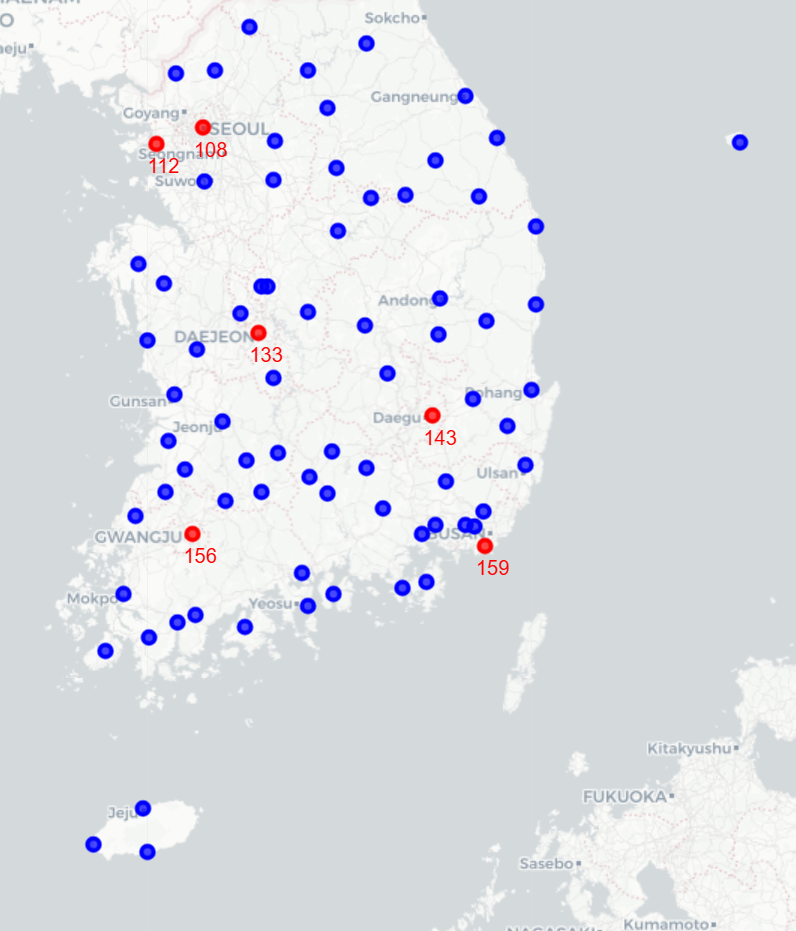
Atmospheric visibility affects transportation safety, aviation operations, and environmental risk management, but low-visibility events are rare and arise from intertwined meteorological and air-pollution conditions. This project studies visibility nowcasting for six major South Korean cities—Seoul, Busan, Incheon, Daegu, Daejeon, and Gwangju—using observed weather and air-quality data from 2018 to 2021.
The paper combines ASOS meteorological observations with AirKorea air-quality measurements, handles class imbalance in the 2018–2020 training period with SMOTENC and CTGAN-based augmentation, and evaluates five machine-learning and deep-learning model families with a CSI-focused objective. Its central finding is balanced: augmentation and ensembling help the modeling workflow, while performance drops on the 2021 test period reveal temporal distribution shift that needs explicit attention in operational nowcasting.
Method
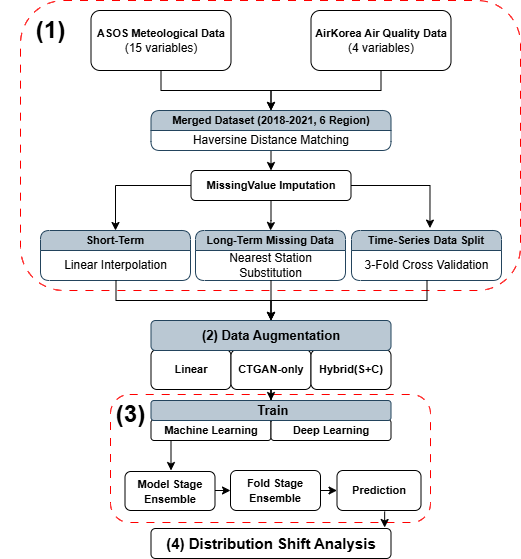
The study treats visibility nowcasting as a tabular time-series classification problem in which the minority low-visibility classes carry the operational risk. Instead of summarizing the pipeline as separate cards, the page follows the paper's sequence: build a regional observation table, address missing values and class imbalance, train machine-learning and deep-learning models, then examine why validation performance does not always transfer to the 2021 test period.
SMOTENC and CTGAN are used because the dataset combines meteorological, air-quality, temporal, and location-related variables, while augmentation targets the minority visibility classes. The modeling stage compares XGBoost, LightGBM, ResNet-like, FT-Transformer, and DeepGBM families, while ensemble voting is used to combine optimized model probabilities without claiming that a single augmentation method universally dominates.
Results
Because rare low-visibility detection matters more than majority-class accuracy, the paper emphasizes the Critical Success Index (CSI). Visibility is grouped into three classes: Class 0 for severe low visibility below 1 km, Class 1 for reduced visibility from 1–5 km, and Class 2 for normal visibility above 5 km. The result figures are curated here to keep the page close to the DoLQ reading style: first the main performance signal, then the distribution-shift diagnosis that explains why cross-validation gains can weaken on a later test period.
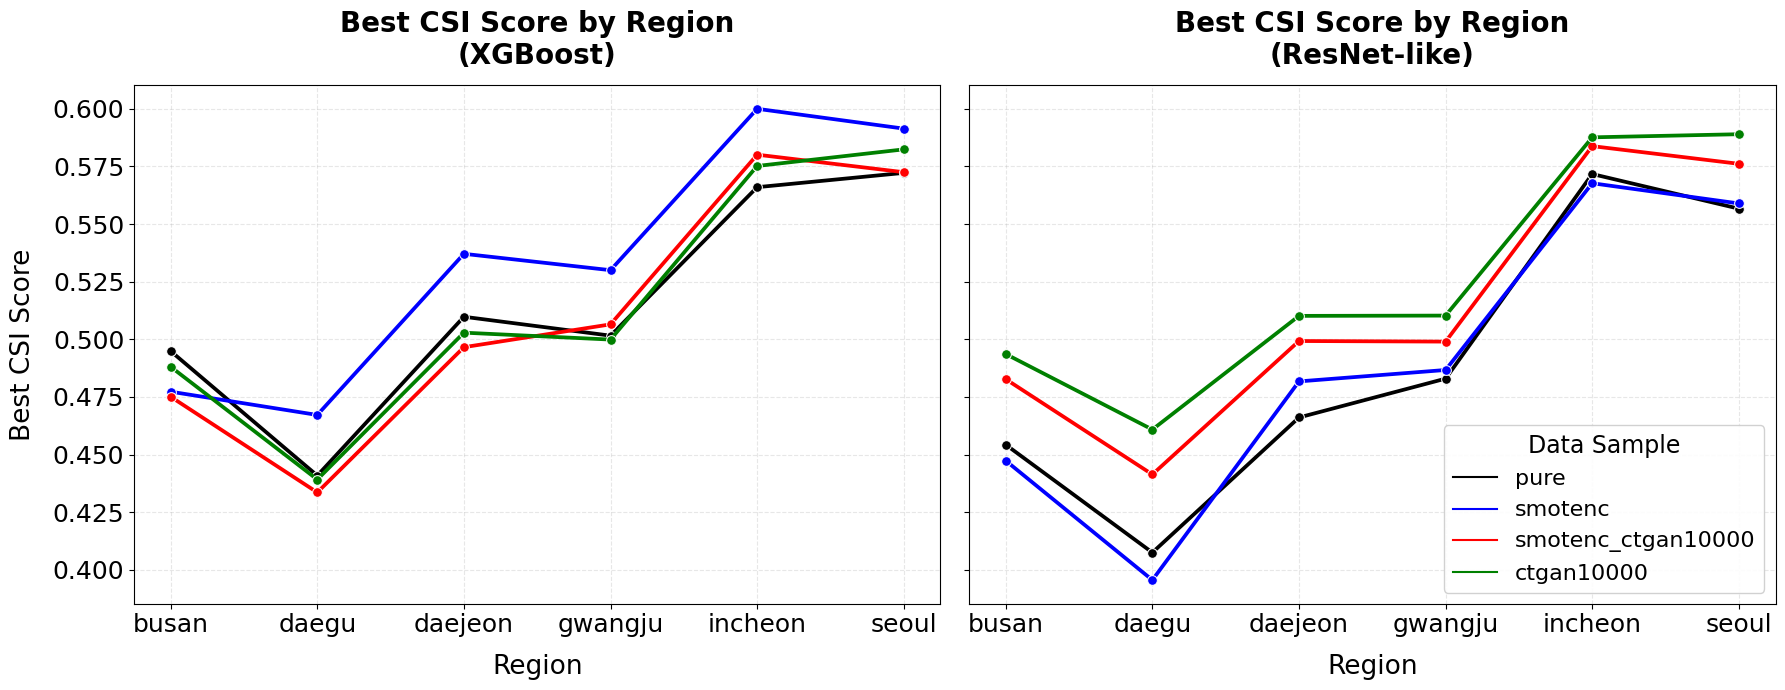
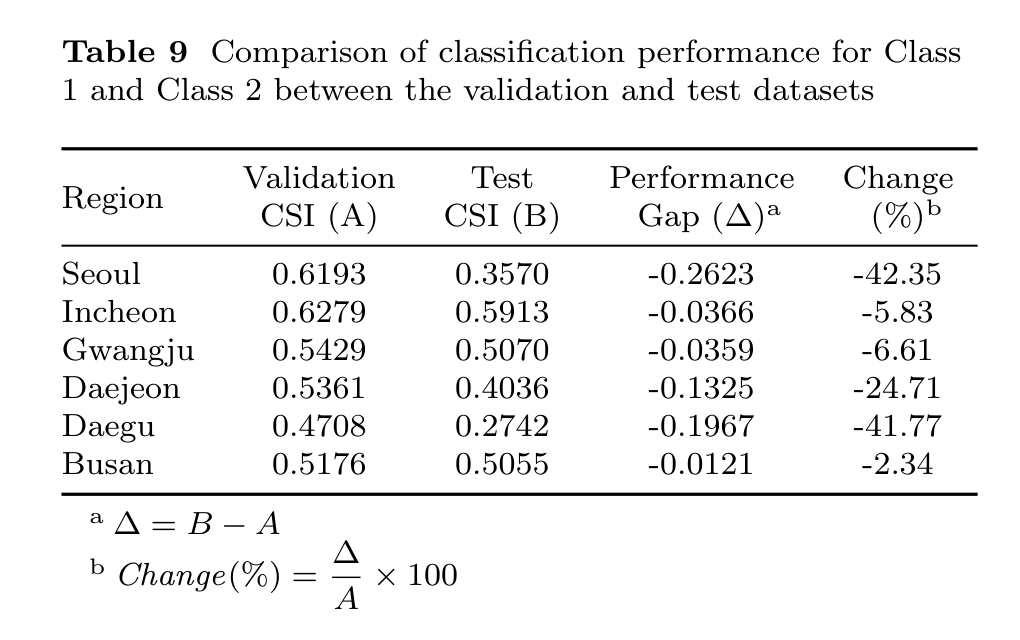
The reported pattern is deliberately nuanced. Augmentation can help rare-event detection, and ensembling can stabilize predictions, but the 2021 test period still exposes a temporal distribution shift. The paper first makes that drop explicit by comparing each region's validation CSI with its held-out test CSI.
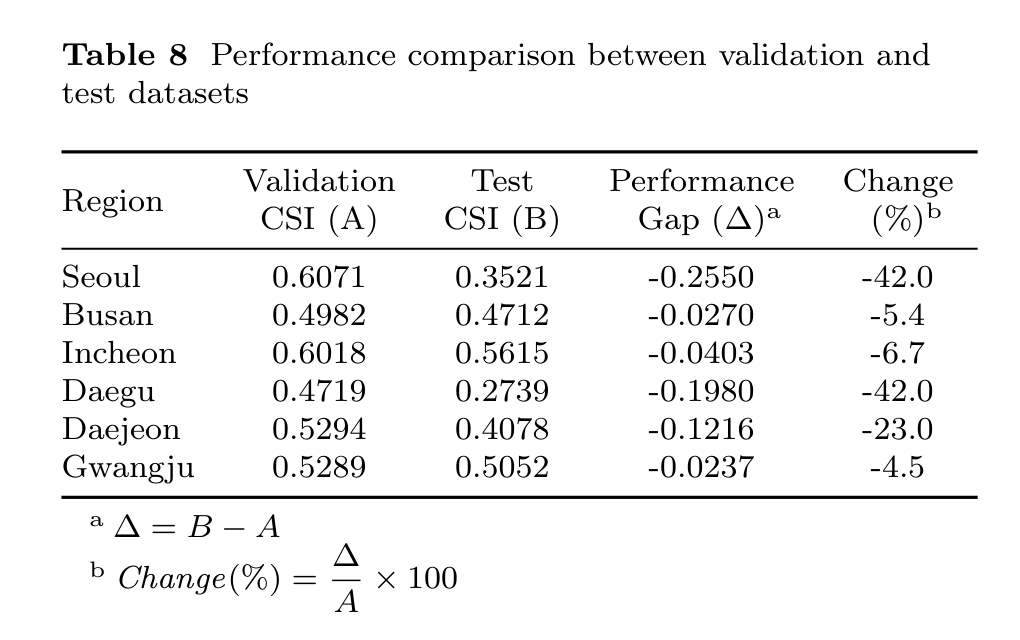
To understand whether the drop comes from confusing reduced and normal visibility, the paper narrows the evaluation to Classes 1 and 2. This keeps the argument in the same order as the published Section 4.4: overall test degradation first, then the class-pair behavior that motivates the distribution-shift analysis.
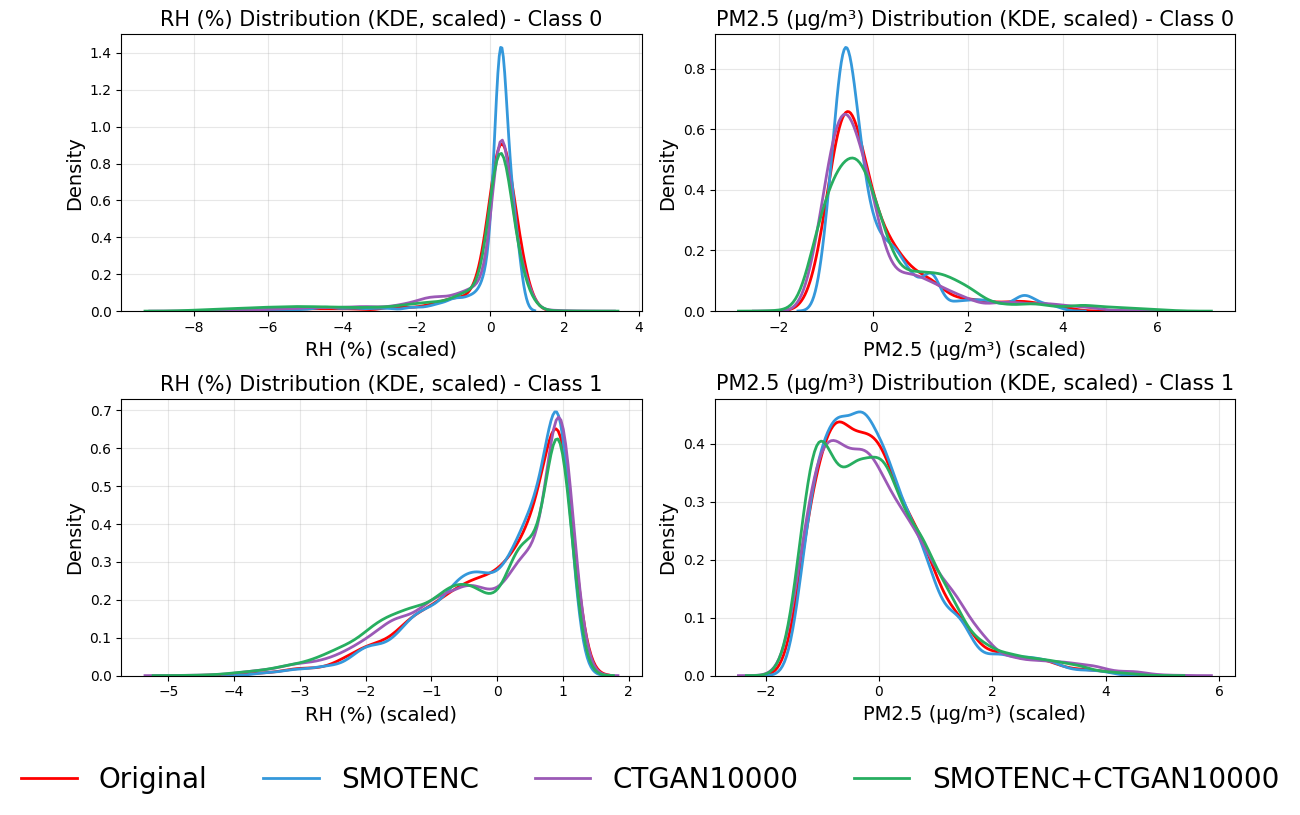
The next step is to connect those performance changes to the feature space. The paper uses SHAP to identify influential variables and then measures how the distribution of relative humidity shifts between the training and test periods; the KDE figure below first shows the paper's synthetic-data fidelity check before the direct train-test shift evidence in Table 11.
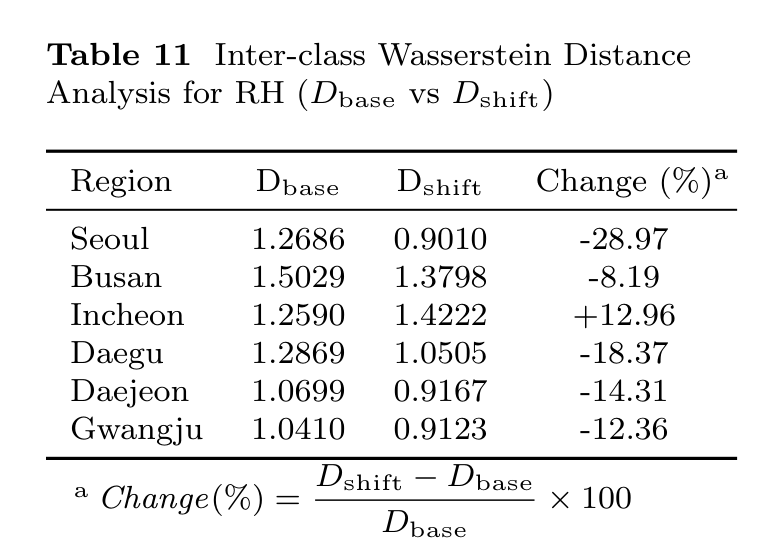
This supports the paper's interpretation that the learned Class 1–Class 2 boundary became less reliable when applied to the 2021 test distribution.
BibTeX
@Article{Shin2026,
author="Shin, Bong Gyun
and Lee, Chan Sik
and Suh, Hyesun",
title="Visibility nowcasting in South Korea: a machine learning approach to class imbalance and distribution shift",
journal="Theoretical and Applied Climatology",
year="2026",
month="Apr",
day="10",
volume="157",
number="5",
pages="283",
issn="1434-4483",
doi="10.1007/s00704-026-06219-6",
url="https://doi.org/10.1007/s00704-026-06219-6"
}